
The Structural Challenge Facing Real Estate
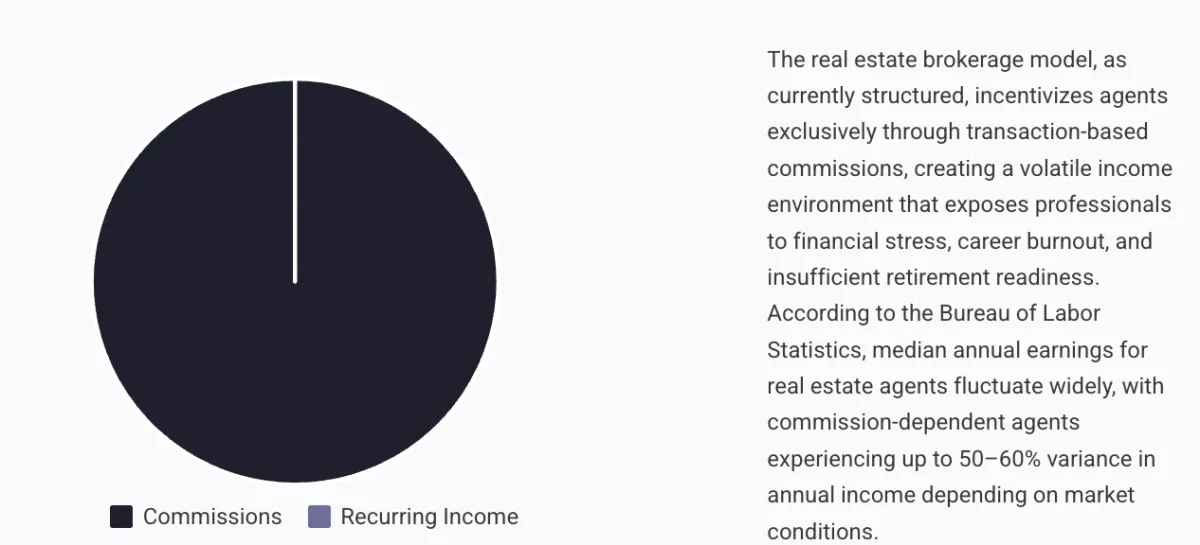
The real estate brokerage model, as currently structured, incentivizes agents exclusively through transaction-based commissions, creating a volatile income environment that exposes professionals to financial stress, career burnout, and insufficient retirement readiness. According to the Bureau of Labor Statistics, median annual earnings for real estate agents fluctuate widely, with commission-dependent agents experiencing up to 50–60% variance in annual income depending on market conditions (BLS, 2025).
This white paper evaluates the structural challenges inherent in commission-only compensation and introduces the Beyond Commissions Model™ as a solution for sustainable agent income diversification.
- →Income Volatility: Agents without diversified revenue experience significant income swings, often resulting in delayed or inconsistent retirement contributions.
- →Retirement Vulnerability: Median retirement savings for real estate professionals are significantly below recommended targets (NerdWallet, 2025).
- →Market Cycle Exposure: Agents face structural exposure to interest rate fluctuations, inventory constraints, and regulatory changes that directly impact transaction volume.
- →Retention Risk: Brokerages report high churn, averaging less than 5 years for agent tenure, increasing recruiting and training costs by 25–30% annually (NAR, 2025).
Agents who rely solely on commission income face significant risk to long-term wealth, financial stability, and career longevity.
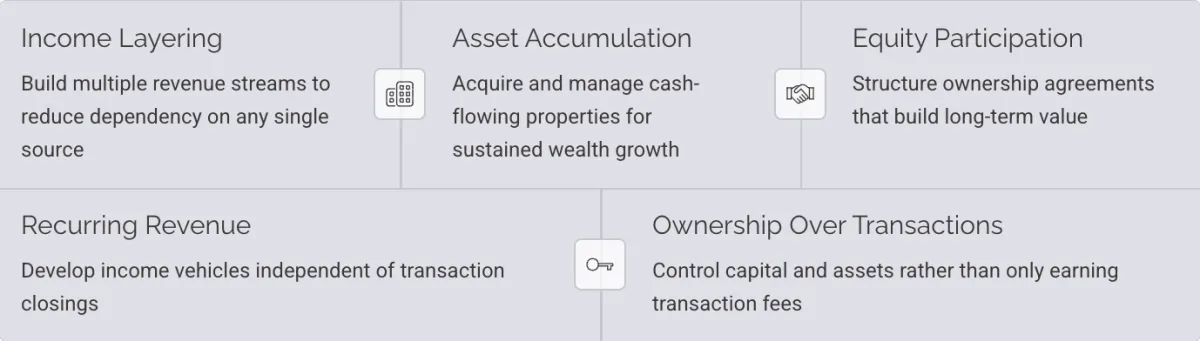
Beyond Commissions™ — Agent Retention Crisis Report, 2026The Beyond Commissions Model™ introduces five pillars — Income Layering™, Asset Accumulation, Equity Participation, Recurring Revenue Vehicles, and Ownership Over Transactions — that stabilize agent income, increase retention, and build long-term wealth.
A Market Built on Structural Fragility
The residential real estate market presents a paradox: agents have access to high transaction revenue potential yet face long-term financial instability due to income concentration risk. Commission-based structures do not reward strategic wealth accumulation, leaving agents dependent on cyclical market conditions.
These structural realities contribute to attrition, particularly among agents seeking long-term career growth. Without supplemental income streams, agents often exit the industry within 5 years, creating a retention crisis for brokerages and teams.
Understanding Income Volatility
Residential real estate agents are highly exposed to income fluctuations. Unlike salaried professionals, agents' income is tied directly to transaction closings, impacted by market cycles, interest rates, inventory availability, and buyer behavior.
- ↗65–70% of agents experience more than 40% year-to-year income variation
- ↗High-performing agents report spikes during strong market months but drops of up to 50% during downturns
- ↗Agents with less than 5 years of experience are most vulnerable, often lacking reserves or supplemental income streams
Retirement Planning Challenges
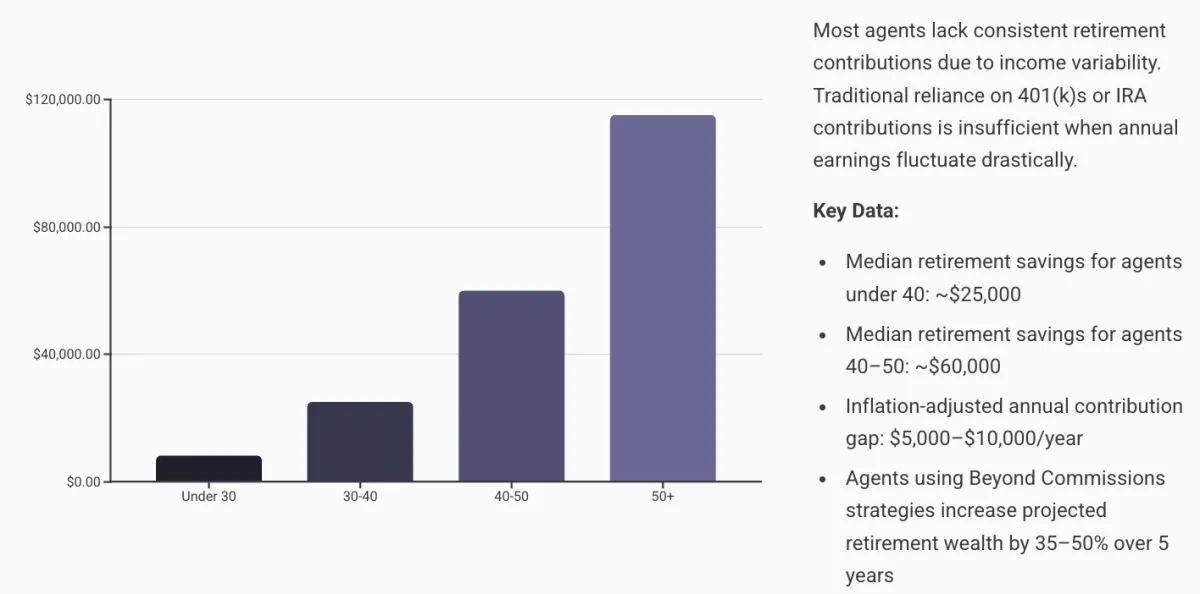
Most agents lack consistent retirement contributions due to income variability. Traditional reliance on 401(k)s or IRA contributions is insufficient when annual earnings fluctuate drastically.
Market Cycle Exposure
Real estate is cyclical. Agents without diversified income are vulnerable to forces entirely outside their control.
- ⚡Interest Rate Fluctuations: A 1% increase in mortgage rates can reduce buyer affordability by 10–15%, directly compressing transaction volume.
- ⚡Inventory Constraints: Low housing supply leads to fewer transaction opportunities, regardless of agent performance.
- ⚡Regulatory Changes: Local laws can delay closings or reduce the buyer pool in specific markets.
Agents using layered income models — rentals, OPM, equity participation — experience only a 10–15% drop in total monthly cash flow during the same market cycles.
Why High Turnover Persists
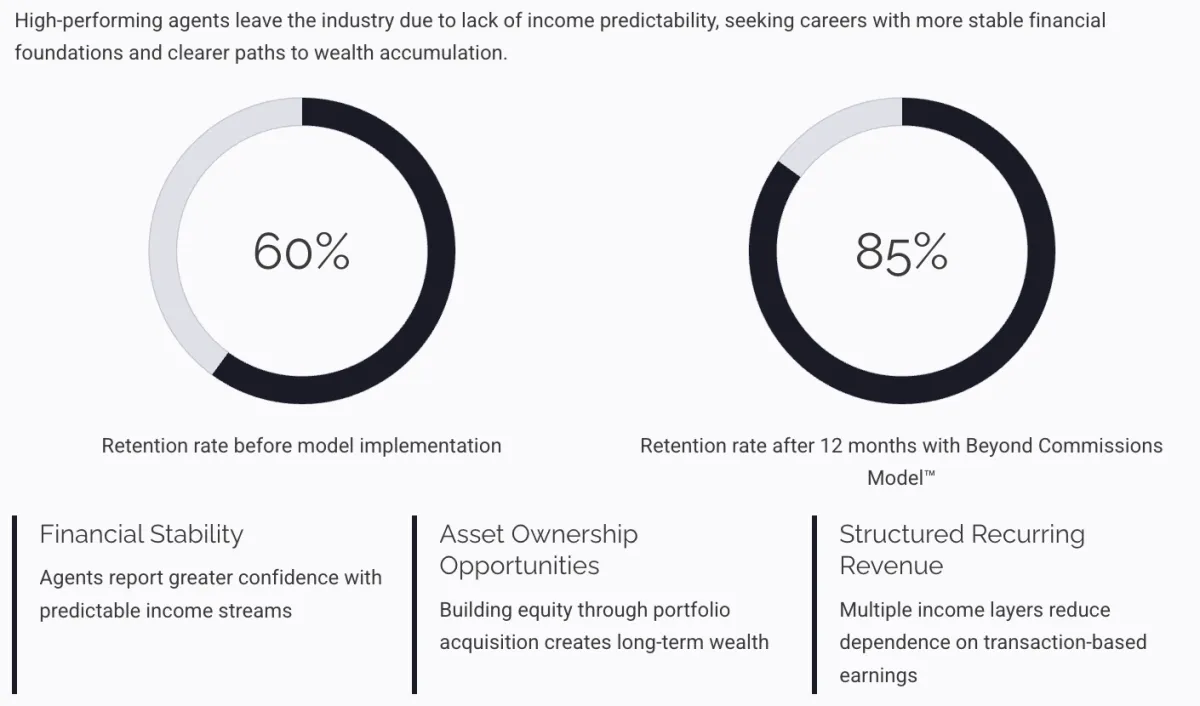
High-performing agents leave not because they lack skill, but because the compensation model doesn't support long-term financial stability.
- →Average agent tenure: less than 5 years
- →Recruitment & onboarding costs: 25–30% of annual budget
- →High-performing agents leave due to lack of income predictability
Agents reported higher satisfaction due to: financial stability, asset ownership opportunities, and structured recurring revenue.
The Beyond Commissions Model™
The Beyond Commissions Model™ is designed to reduce income volatility and provide long-term wealth-building frameworks. It leverages creative financing, OPM, and equity participation strategies to stabilize agent earnings and increase asset ownership.
A 5-Phase Implementation Model
This framework is not a theory. It is implemented through structured income modeling, strategic alignment planning, operational integration, and platform-based education and tools.
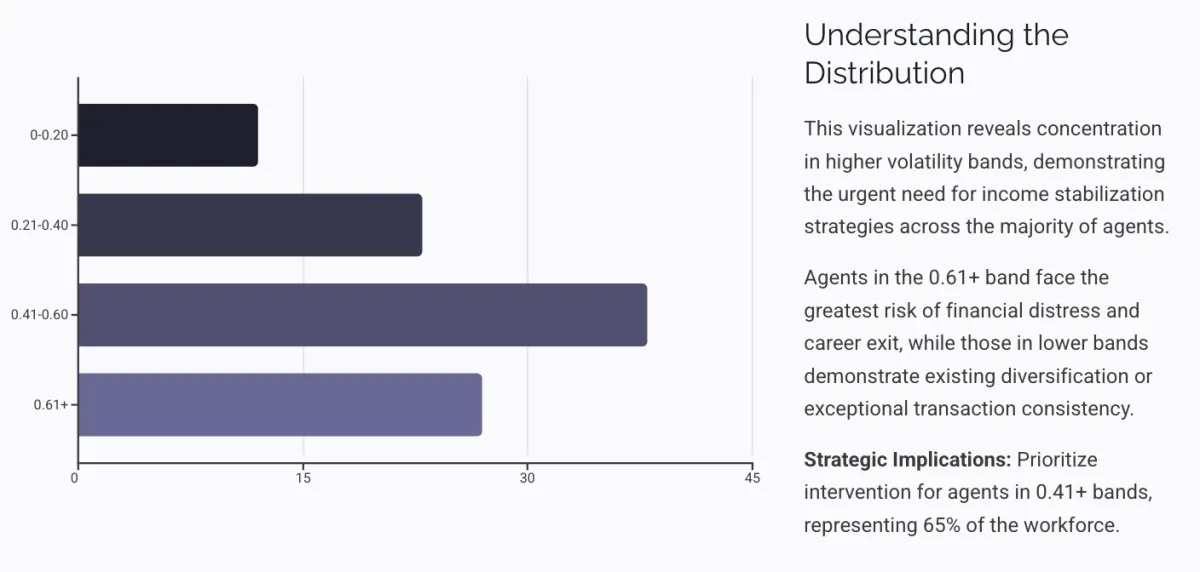
Before introducing diversification strategies, brokerage leadership must quantify exposure. Phase I includes a structured diagnostic: 24-month agent production history, commission concentration ratios, income variance by quarter, agent retention by tenure band, and retirement preparedness indicators.
Education must move beyond transactional skills. Phase II introduces curriculum around the five pillars: income diversification modeling, creative financing strategies, OPM structuring fundamentals, risk mitigation protocols, and retirement asset positioning. Delivery via quarterly workshops, structured cohorts, or hybrid curriculum.
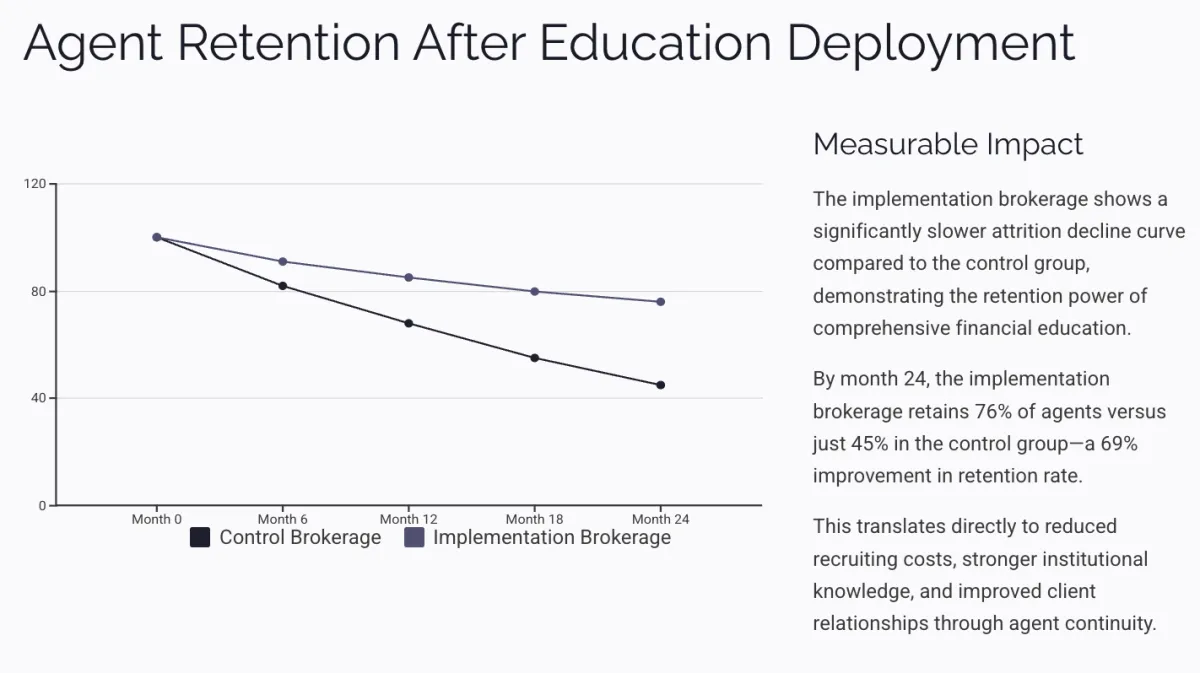
A 6–12 month pilot cohort should include 10–20 mid-to-high producers, mixed tenure agents, and voluntary participation. Key metrics: income stability change, asset acquisition rate, savings improvement, retention rate, reported financial confidence.
Average net cash flow per agent: $300/month.
Total recurring baseline created across cohort: $36,000 annually.
This recurring baseline materially reduces departure risk during downturn cycles.
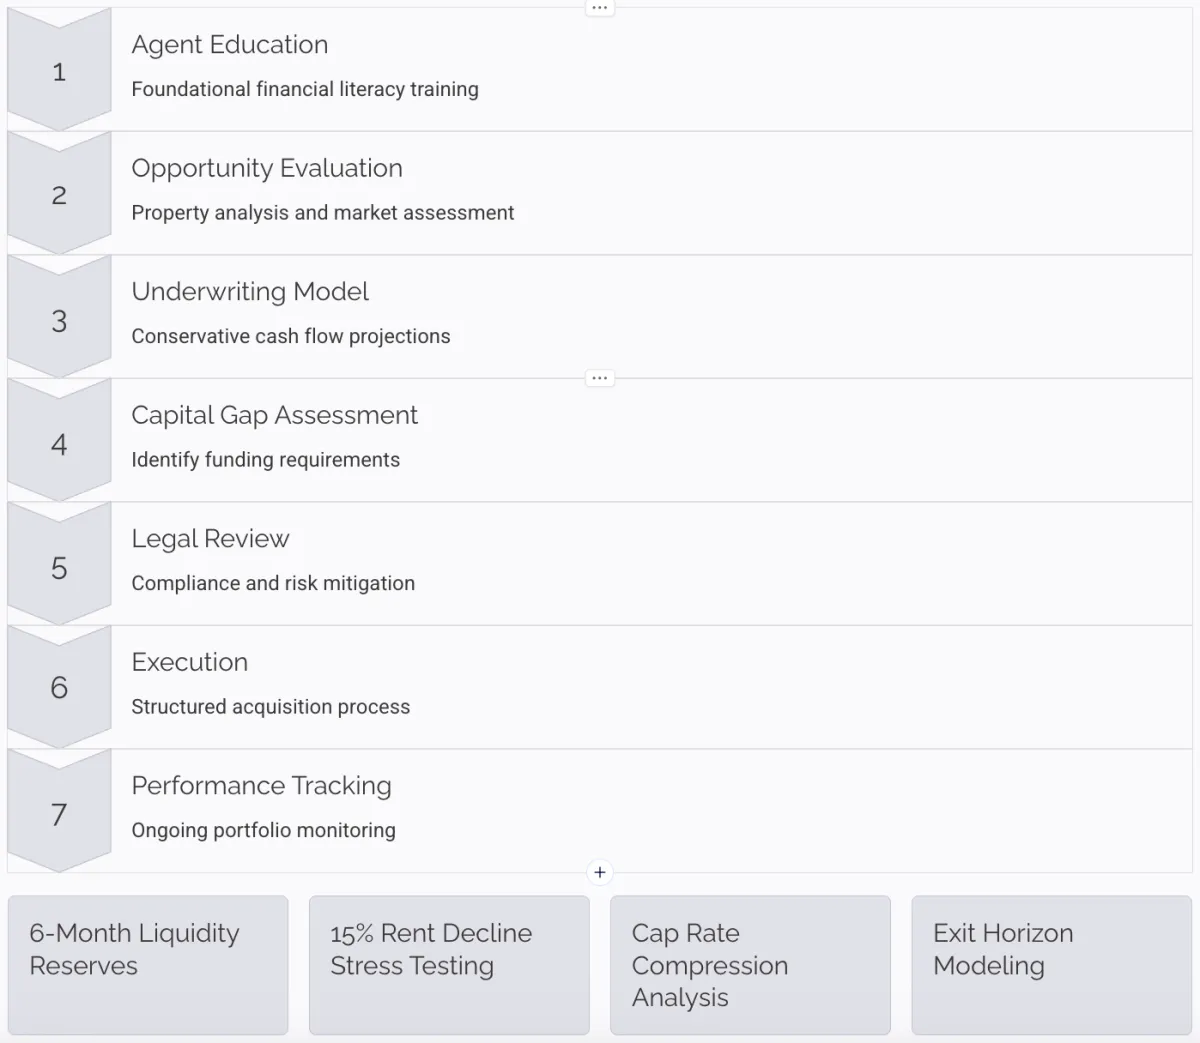
Access to capital is the primary scaling barrier. Brokerages facilitate education and introductions — not act as lenders or securities issuers. Includes: education on private capital structuring, DSCR lending, subject-to risk parameters, and seller financing frameworks. Risk mitigation: 6-month liquidity reserves, stress testing for 15% rent decline, cap rate compression analysis, exit horizon modeling.
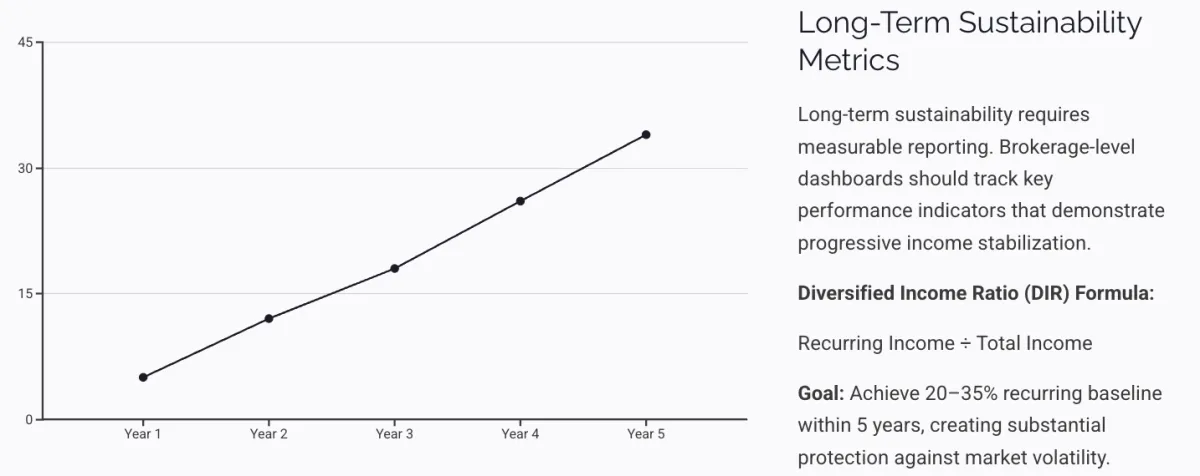
Brokerage-level dashboards may track diversified income ratio, portfolio participation rate, retention delta, agent net worth growth indicators, and production stability year-over-year.
Months 4–12: Pilot Cohort + First Asset Acquisitions
Year 2: Expansion Cohorts + Capital Structuring Maturity
Year 3: Institutionalized Reporting + Retention Stabilization
Expected Outcomes by Year 3: 15–25% reduction in agent attrition · 20%+ recurring income baseline across pilot participants · Increased brokerage valuation stability
Acquisition Strategy Breakdown
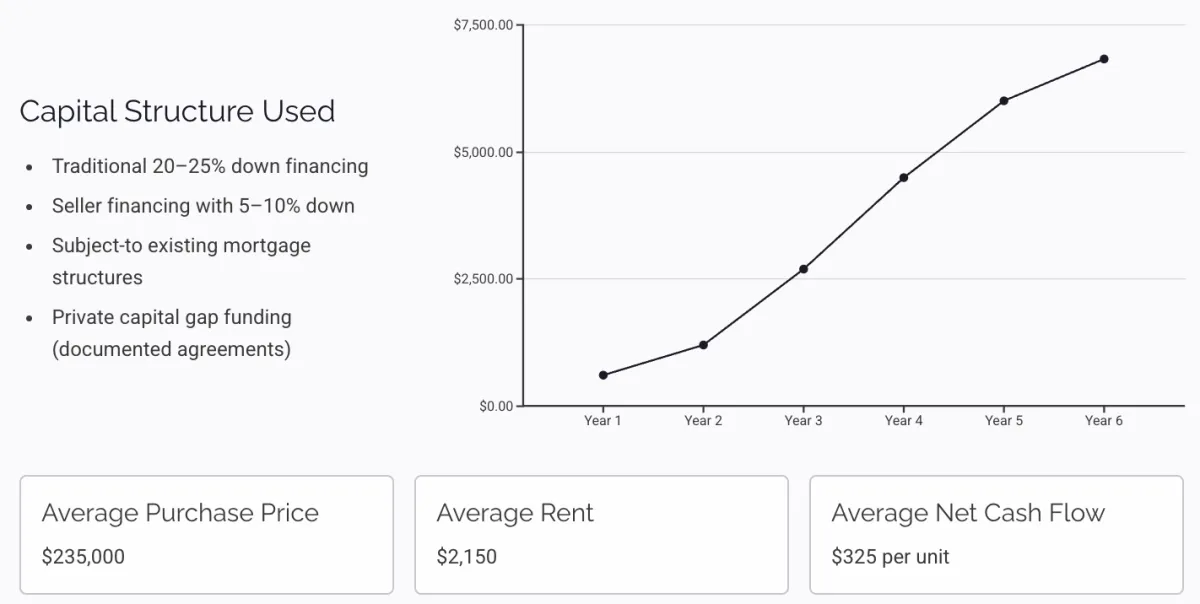
The following demonstrates application of the Beyond Commissions Model™ in practice — a portfolio built using layered capital structures over a multi-year period.
- 🏠Portfolio Built: 21 residential rental units — 16 single-family homes acquired in 17 months, 5 additional units over multi-year period
- 💰Capital Structures: Traditional 20–25% down · Seller financing with 5–10% down · Subject-to existing mortgage · Private capital gap funding
- 📊Avg Purchase Price: $235,000 · Avg Rent: $2,150 · Avg Net Cash Flow Per Unit: $325
- 📈Total Net Monthly Portfolio Cash Flow: ~$6,825 · Annual: ~$81,900
Conservative 4% annual appreciation over 6 years yields substantial equity expansion without aggressive speculation.
Portfolio Stability Controls
- ✓Fixed-rate debt prioritization
- ✓Conservative rent underwriting
- ✓Vacancy reserves maintained
- ✓Property diversification across submarkets
- ✓No overleveraged acquisition stacking
Redefining Sustainability in Real Estate
If implemented broadly, the Beyond Commissions Model™ may reduce agent attrition, increase financial resilience, stabilize brokerage production, decrease burnout rates, and increase long-term industry retention. The real estate industry does not suffer from lack of opportunity — it suffers from structural income fragility.
Commission income is powerful.
Commission dependency is fragile.
The Agent Retention Crisis is not solely a recruiting issue. It is a structural financial design issue. The Beyond Commissions Model™ introduces income diversification architecture, asset-backed equity strategy, OPM structuring discipline, retirement resilience planning, and brokerage-level implementation sequencing.
This is not an abandonment of the commission model. It is an evolution toward sustainable income design. Brokerages that recognize this shift early will define the next generation of real estate leadership.
Ready to apply this framework?
Download the full whitepaper or schedule a strategic conversation to explore implementation for your brokerage.